
 Reading Time: 4 minutes
Google Analytics has released a new add-on feature where you can create a heat map within the Page Analytics program. While there are many ways to create a heat map in your SEO technology stack, it’s helpful to know how to create one right in your analytics suite. We will dive into the details of how to effectively use the back end of Google to view deeper statistics of your site through the new heat map.
History of Heat Maps
Let’s begin by discussing what a heat map is, as well as a bit of the history behind it. Heat maps originated as 2D displays of data, shown in a data matrix. The larger values were represented in dark colors, such as black and gray, and the smaller values were represented as lighter pixels, fading out to white. Ideas of a matrix that uses shading from light to dark to display values date back to the 1870s. By the 1950s, scientists were able to display results similarly with a more sophisticated “cluster analysis” by illustrating similar data close together in columns.
By the 1970s, the idea to bring the process of data clustering into something more visually akin to the shading map of the past was born. Thus, something like our modern heat map was created. It was trademarked in the early 1990s by software designer Cormac Kinney, and was originally used to illustrate financial data. With the passing of time and the extraordinary expansion of the web, heat maps can now be used to illustrate almost any kind of data.
Now that we know a bit about the history of the heat map, it brings us to how (and why) heat maps are used today. Web heat maps are used to display which areas of a web page are most frequently scanned by visitors. As you probably already know, this is useful knowledge for anyone diving into their website analytics with Google, or any other analytics tool.
Though the heat map isn’t actually based on heat, of course, it does visually mimic tests that show heat or activity in the body. It’s like a CT scan for your web page. Rather than using actual heat from the human body to determine where a viewer crawled your website, heat maps are using algorithms that can make a very sophisticated guess where viewers are lingering. This helps you to create more content that your clients, users, and viewers will love. In the end, it will bolster your web presence.
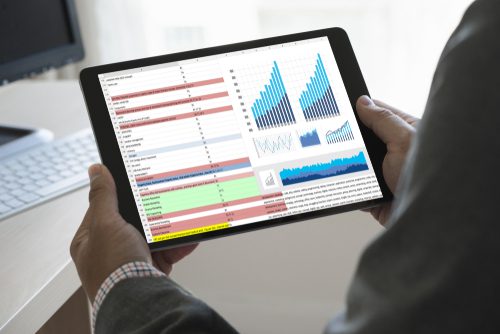
Google Analytics Heat Map
Across the board, Google Analytics is a powerful tool that provides a wide-ranging body of information about how and where visitors are viewing you on the web. However, the tool is so massive, it can be difficult to wrap your head around what all of the information tables mean. What tools do you need to be using? What tools are better in another suite? When you’re feeling overwhelmed by the tool in general, it’s a great time to pull up your heat map. It offers the perfect opportunity to view digestible information side by side with your website. It’s perfect for users who prefer a visual to numeric presentation of statistics. Not only can you see which pages visitors are gravitating toward, you can also see where on the page they are lingering and what they are (and aren’t) interacting with. This can give important insights for appropriately placing keywords, links, and important information.
How to Download the Heat Map
Google allows you to view this tool using an add-on in Google Chrome called Page Analytics (by Google). To use the add-on, you must previously have installed Chrome, and then install the add-on. It’s easy to access the heat map anytime in the Page Analytics add-on. You can even bookmark it to the top of Chrome, so that you can view changes in your heat map any time. Here are a few easy steps:
- Install Chrome
- Download Page Analytics add-on by Google
- Bookmark for easy access to heat map
- Start enjoying your heat map visuals whenever you need them
You may be wondering if using the heat map in Page Analytics is really more effective than using a dedicated heat map tool a la carte. Actually, there are more in-depth heat maps that show you more information and statistics, and some users visually prefer other heat maps. However, using the heat map provided by Google’s Page Analytics is convenient, part of a suite you are likely already using, and shows everything you will need.
Some examples of the types of information you can see with your heat map are:
- Links and tabs below the fold that aren’t being clicked
- Information that is being scrolled over
- Icons that are rarely clicked because they don’t look clickable
- General information that isn’t useful and is being ignored by visitors
- Understanding when users are visiting and the best times to publish
- Discovering the best times to organically promote content or products
- Data to build PPC strategies
- Pinpointing the best areas for CTAs and sign-up forms
Getting eyes on your Google Analytics heat map not only helps you expand your repertoire in analytics tools and SEO auditing, it can also give you invaluable knowledge on how to optimize your site. There’s more to optimization than keywords and links. It’s important to use tools to make sure your site is laid out logically, aesthetically pleasing, and in such a way that visitors understand what is and isn’t important.
You also want to ensure everything that is clickable or interactive looks that way. When you are trying to drive users to specific links or pages, you want the design to look and feel visually intuitive. All of these aspects of your site can be improved by using the Page Analytics by Google heat map. Get started today! If you have questions about diving deeper into the analytics of your site, contact us at Vizion Interactive. We have a wide range of services and the knowledge to help.


